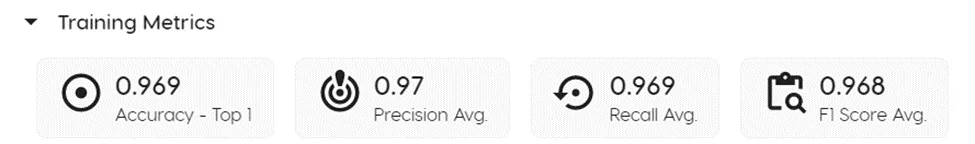
Training Metrics
Overview
The first row of results, under the "Training Metrics" section, measure the performance of the model training process.
General Metrics
Accuracy
How well a model correctly classified instances out of the total instances it has evaluated. It is calculated as the ratio of correctly classified instances (both true positives and true negatives) to the total number of instances. A high accuracy (1 being 100%) means the model is good at identifying both positive and negative cases correctly. However, accuracy alone may not be a sufficient metric to evaluate model performance, especially when there is a class imbalance in the data. For instance, if 95% of the samples belong to class A, and the model always predicts class A, then the accuracy will be 95%, but the model is not really learning anything useful.
Precision
A measure of how well a model correctly identifies positive instances among those that it has predicted as positive. In other words, it tells you what proportion of the instances the model has labeled as positive are actually positive. A high precision means the model is good at avoiding false positives (incorrectly labeling negative instances as positive). High precision is particularly important in applications where false positives are costly, such as medical diagnoses or fraud detection.
Recall
Recall measures the ability of a classification model to identify all relevant instances (i.e., true positives) in the dataset, regardless of whether they are predicted as positive or negative by the model. In other words, recall measures the completeness of the model's predictions for the target class. A high recall means that the model can identify most or all of the relevant instances in the dataset, while a low recall means that the model misses many of the relevant instances.
F1 Score
The F1 score is a measure of the balance between precision and recall. It provides a way to evaluate the model's performance when both precision and recall are important. The F1 score ranges from 0 to 1, with higher values indicating better model performance.
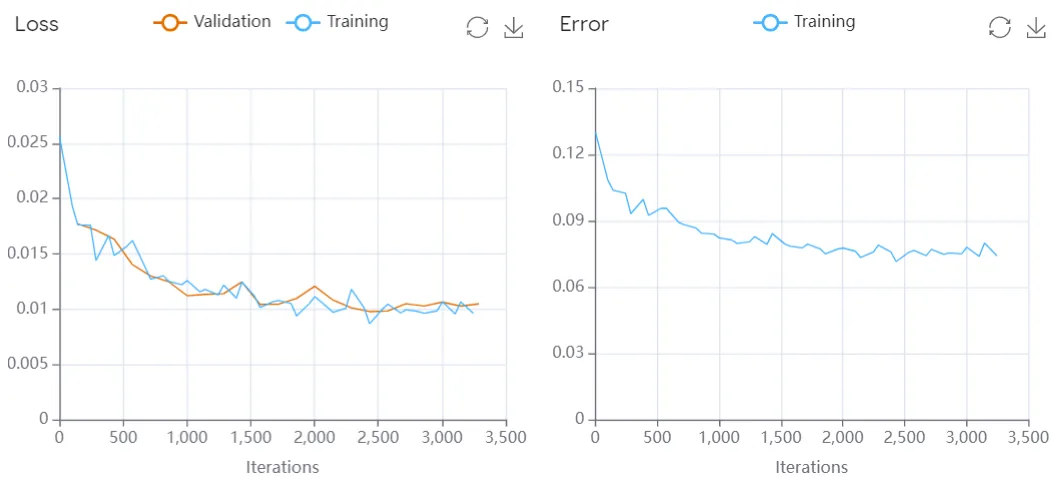
Loss
The loss function measures the difference between the predicted values and the actual values. It is a measure of how well the model is able to fit the data. The loss function ranges from 0 to 1, with lower values indicating better model performance.
Error
The error function measures the difference between the predicted values and the actual values. It is a measure of how well the model is able to fit the data. The error function ranges from 0 to 1, with lower values indicating better model performance.
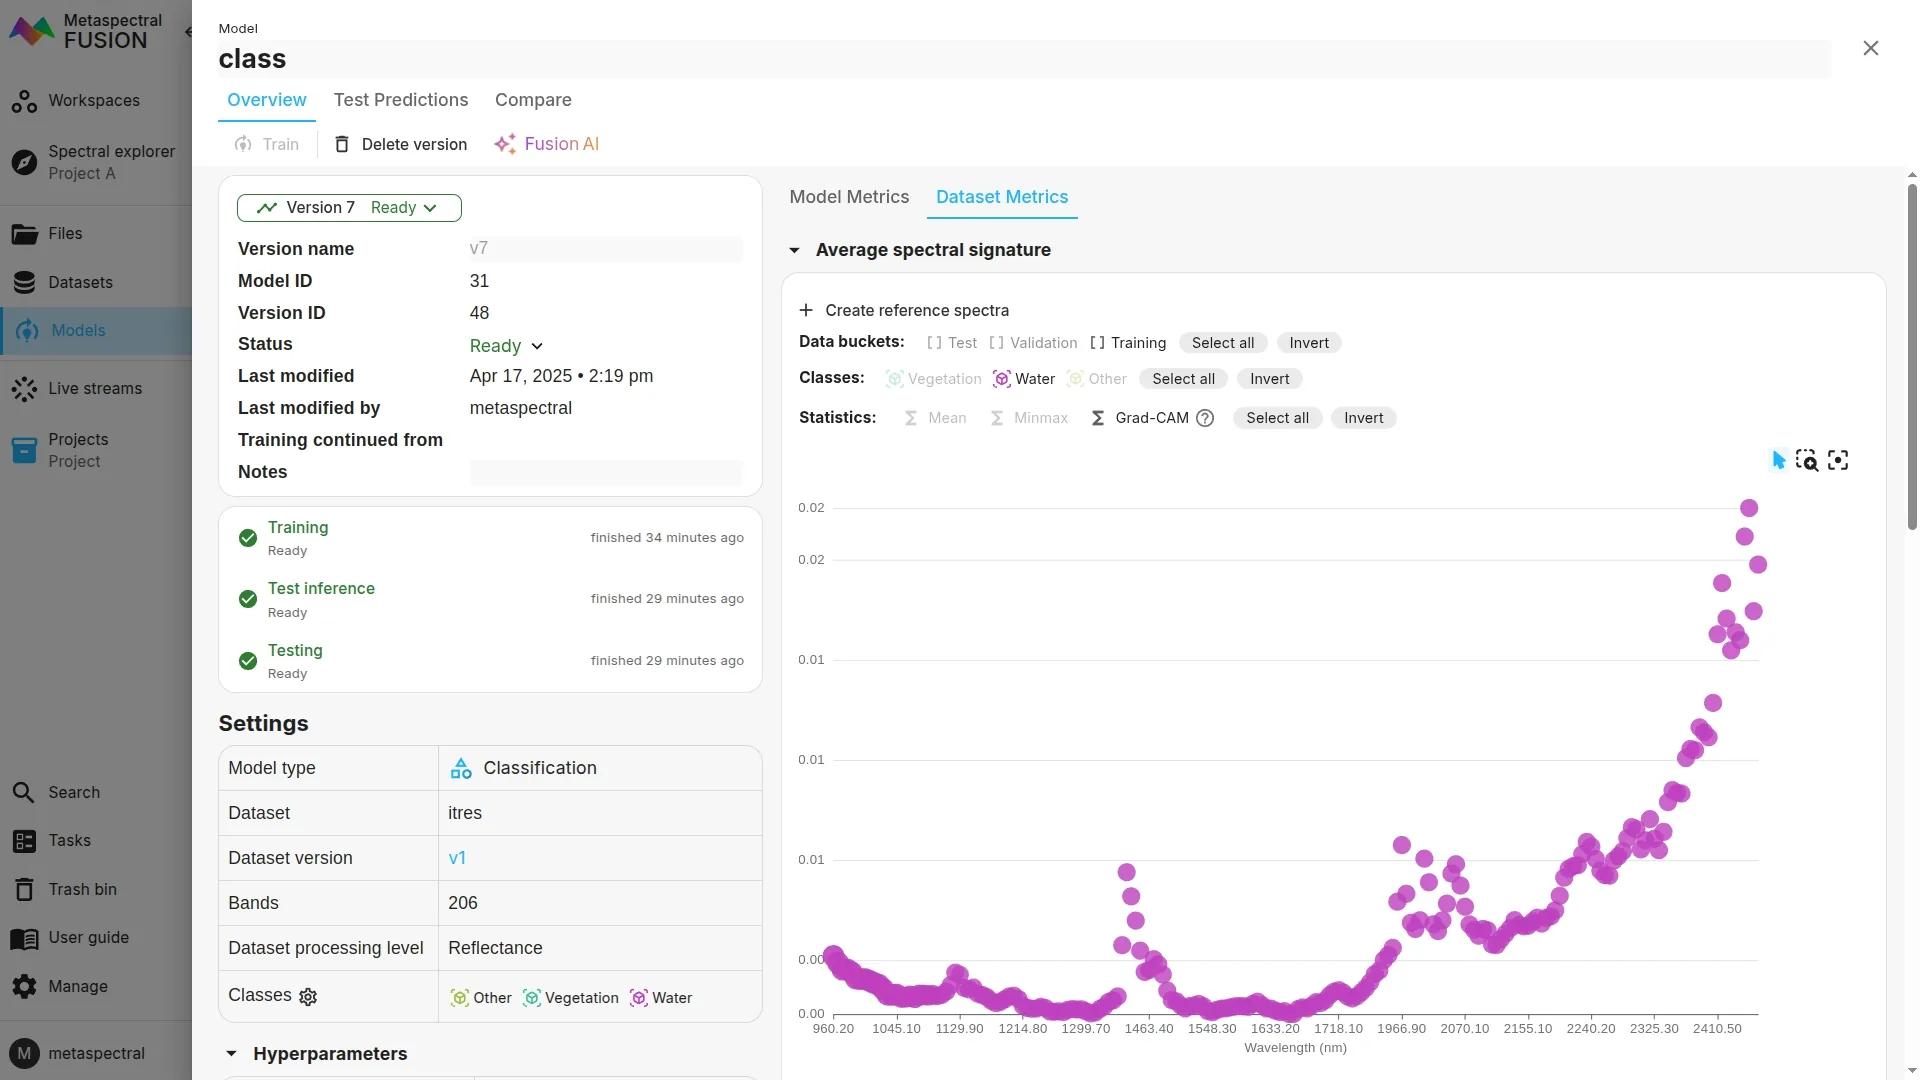
GradCAM
GradCAM is a method for visualizing the regions of an image that are important for the model's predictions. It is a post-hoc explanation method that can be used to understand the model's predictions.
To view the GradCAM in Clarity, click on Dataset metrics after training your model, and then make sure Grad-CAM is enabled.
The busier the plot, the more important the region is for the model's predictions. You can also hover over the bands to see the corresponding values.
Normalized Confusion Matrix
Shows what percentage of the model's predictions were correct for each class (1 = 100%). If a model is making incorrect predictions (i.e true / false positive, true / false negative), a non-0 value will appear in the upper right and lower left cells of the matrix.
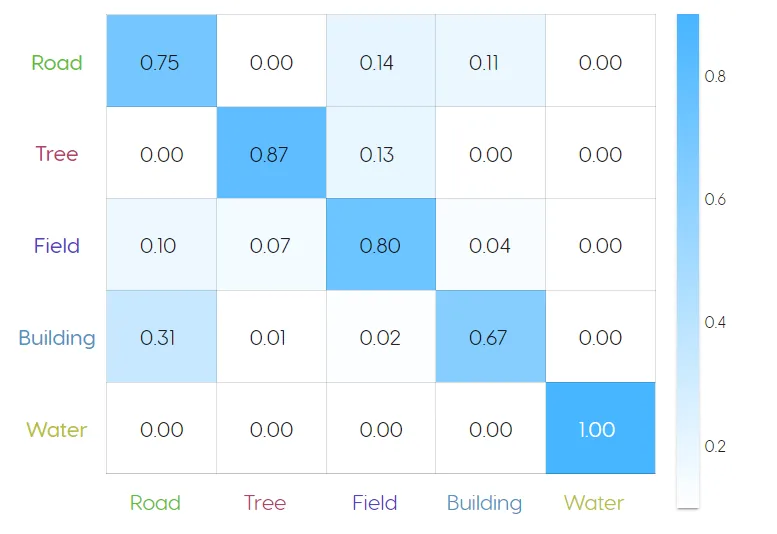
Evaluating performance:
- The model above identified water with 100% accuracy, but only identified buildings with 67% accuracy, mistaking them for roads 31% of the time. This is likely due to the fact that some buildings have asphalt roofs, which is the same material as the roads.
- The performance can be improved by selecting more building and road examples for the training data, to allow the model to more effectively distinguish between the two spectral signatures.
- High accuracy doesn't necessary mean that the model performed well, as this can be a signal of overfitting. That is why it is important to evaluate model performance using the metrics discussed above, as well as visually audit its performance on new images that the model was not trained on.
Specific Metrics
Classification Models
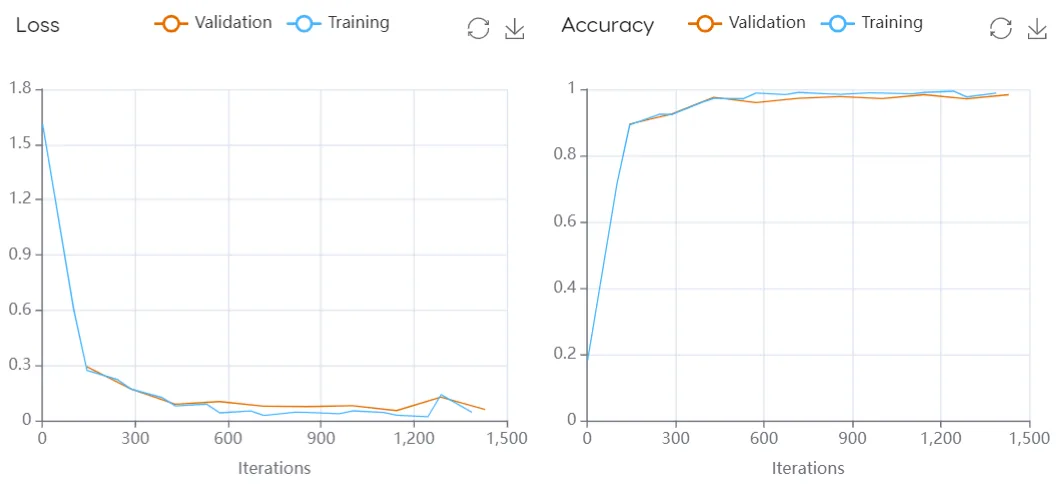
Loss function - Evaluates the model's ability to generalize to new data by measuring how well the model makes predictions on the training data. It plots the loss function values over time during training (i.e., iterations). If the model is overfitting (i.e., performing well on the training data but poorly on the validation data), the loss on the training data will decrease over time while the loss on the validation data will increase. This results in a widening gap between the training and validation loss curves.
Accuracy function - Similar to the loss function, the accuracy graph tracks the training performance over time with a training and validation curve. However in this case, the graph shows the proportion of correct classifications made by the model over time, looking at how well the model is able to classify the targets it is trained on.
Unmixing Models
Loss function - Evaluates the model's ability to generalize to new data by measuring how well the model makes predictions on the training data. It plots the loss function values over time during training (i.e., iterations). If the model is overfitting (i.e., performing well on the training data but poorly on the validation data), the loss on the training data will decrease over time while the loss on the validation data will increase. This results in a widening gap between the training and validation loss curves.
Error function: Shows how the error of a model changes over time. Error is a measure of how much the model's predictions differ from the actual values. In general, we want the error to decrease as the model learns more about the data.