Data Preprocessing
Overview
Preprocessing transforms spectra before training to improve model stability and accuracy. Multiple methods can be combined in a preprocessing pipeline to address different data characteristics.
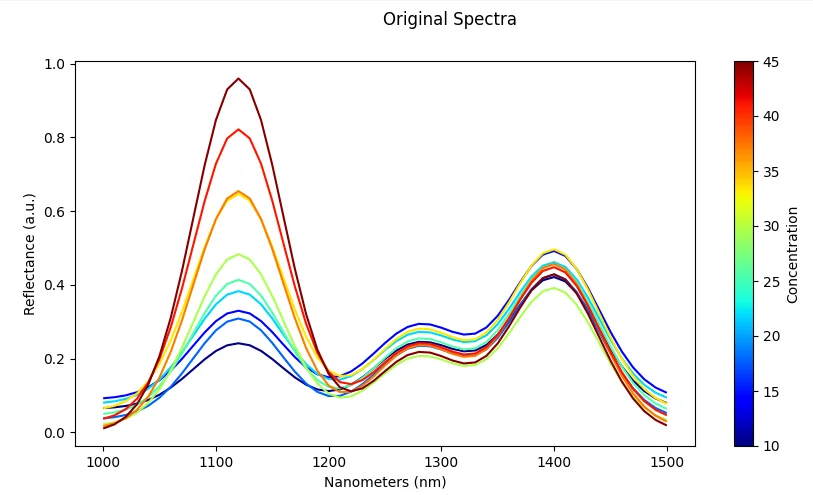
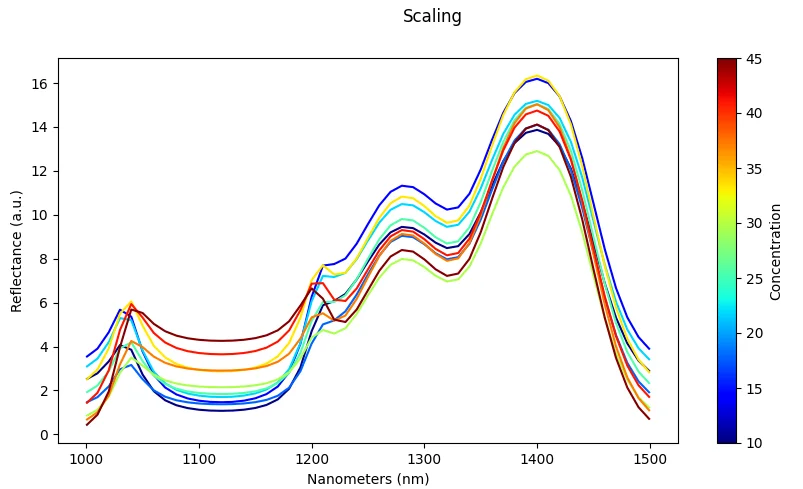
The plot below shows spectra presenting additive and multiplicative scattering effects for various levels of a synthetic compound with arbitrary concentration values.
Band Processing
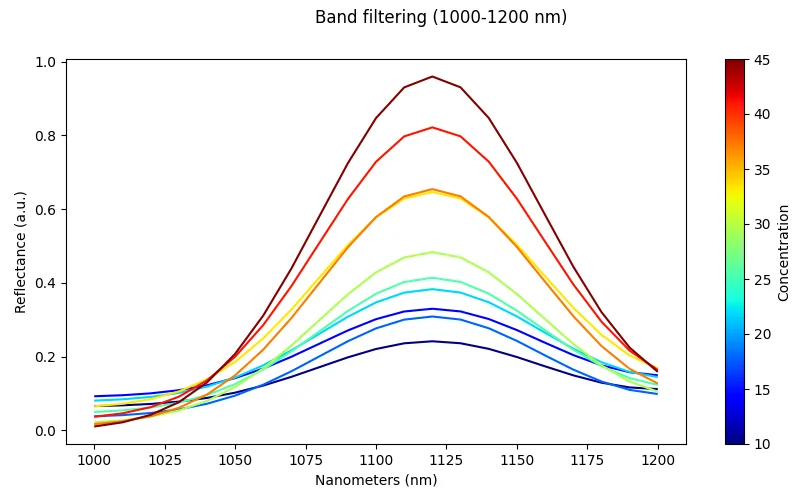
Spectral Band Filtering
What it does: Keep only selected wavelengths from the full spectrum.
Effect: Focuses the model on the most informative spectral bands, reducing noise and computational requirements.
Risk: Removing too many bands may discard useful information needed for accurate classification.
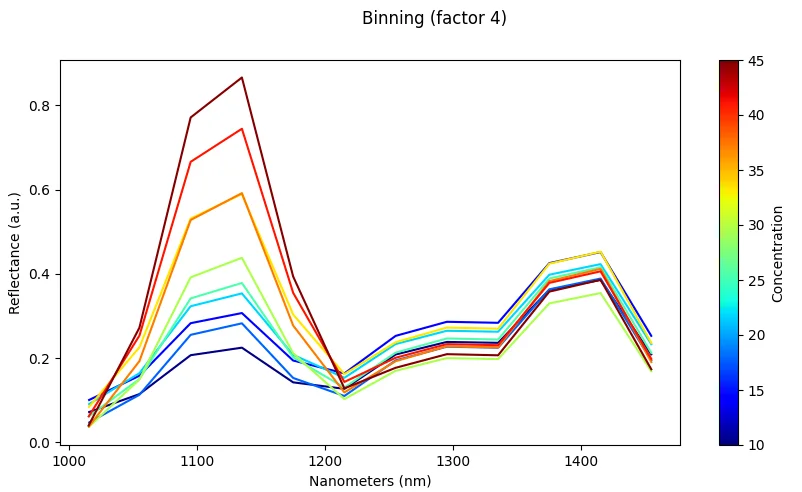
Spectral Downsampling (Binning/Averaging)
What it does: Average neighboring spectral bands together to reduce dimensionality.
Effect: Reduces dimensionality and noise while maintaining essential spectral information.
Risk: Fine spectral details and narrow absorption features may be lost.
Scaling & Normalization
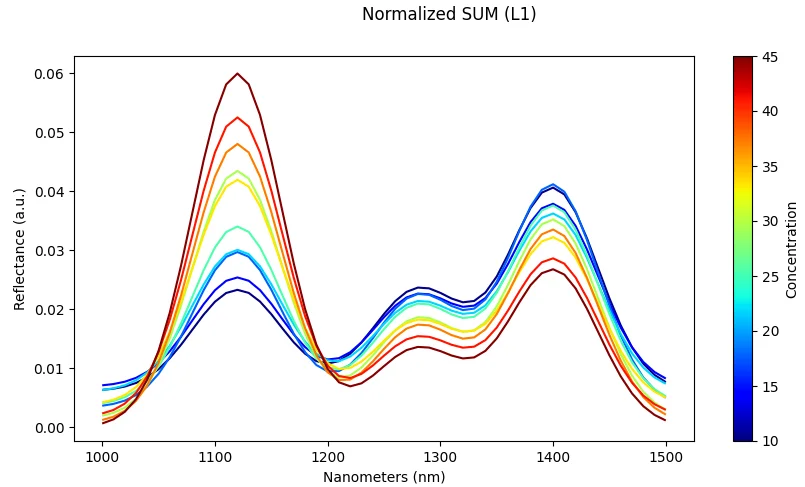
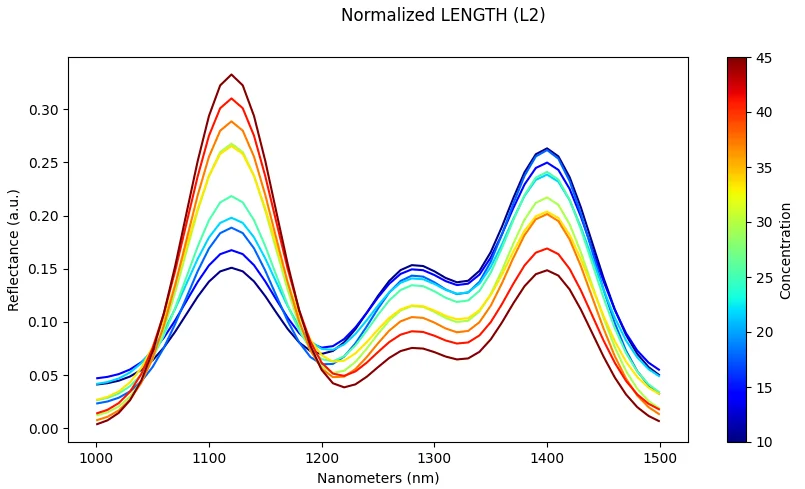
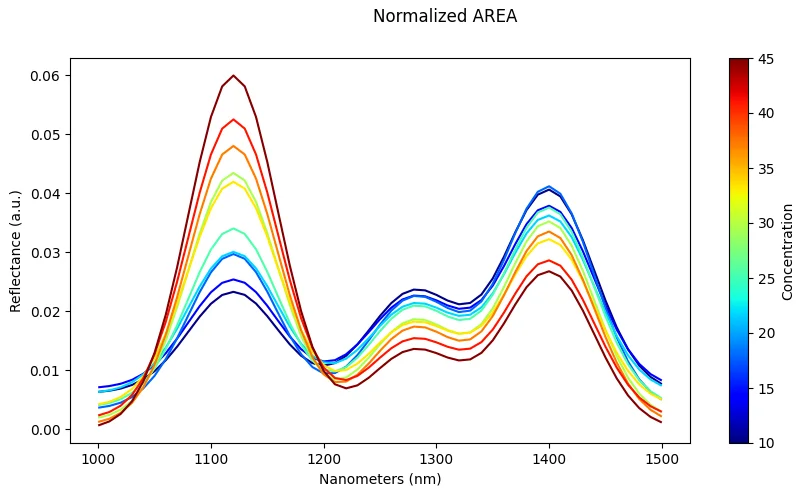
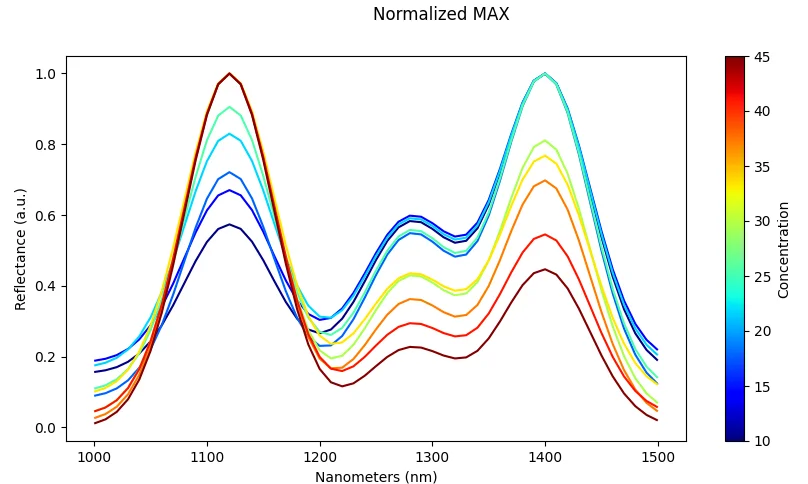
Normalization (Per-Spectrum)
What it does: Scale each spectrum independently (e.g., divide by maximum value or vector length).
Effect: Reduces illumination differences and amplitude effects between measurements.
Risk: May remove useful absolute intensity information that could be discriminative for some classes.
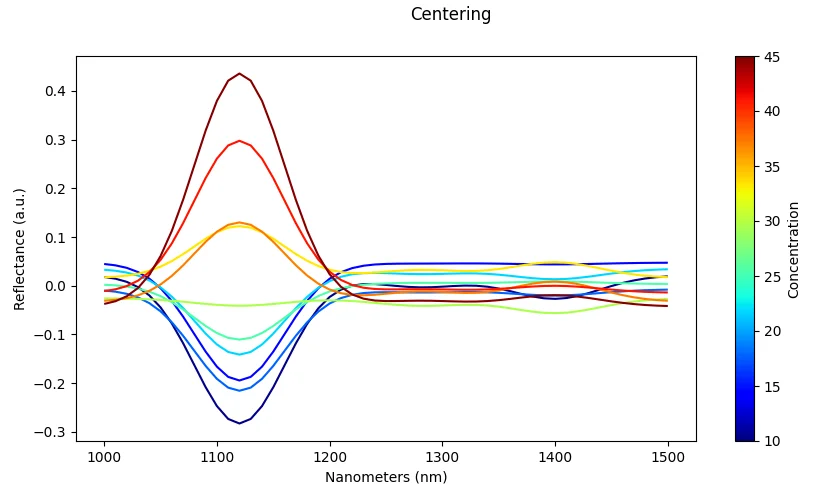
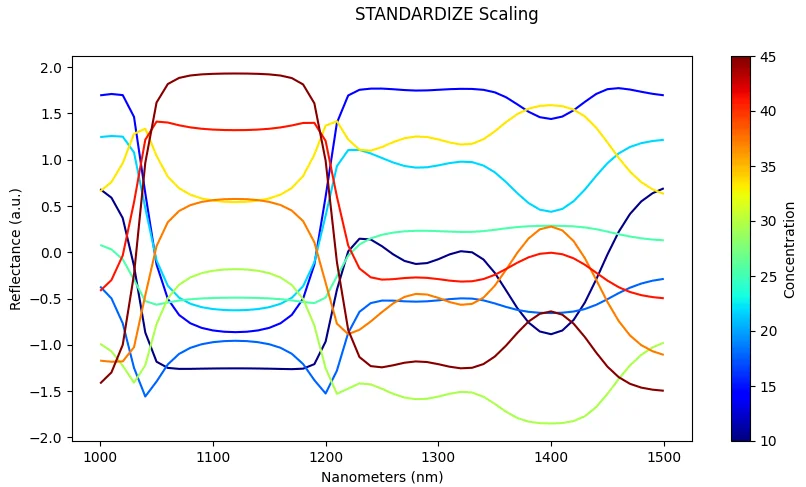
Scaling (Dataset-Level)
What it does: Standardize across all samples using dataset statistics (mean and standard deviation).
Effect: Ensures features are on comparable scales, which improves optimization and convergence during training.
Risk: Can be sensitive to outliers if not handled carefully; extreme values may skew the scaling.
Scatter Correction
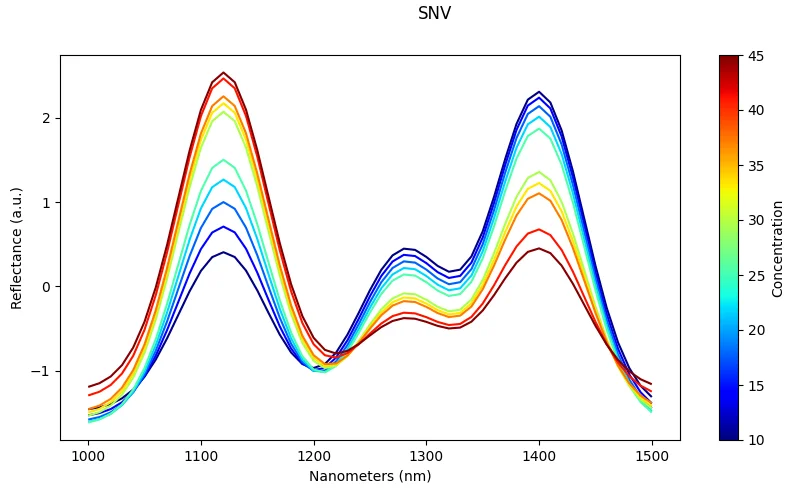
SNV (Standard Normal Variate)
What it does: Normalize each spectrum by its own mean and standard deviation.
Effect: Corrects multiplicative scatter effects common in reflectance spectroscopy.
Risk: Can amplify noise in weak signals or spectra with low signal-to-noise ratio.
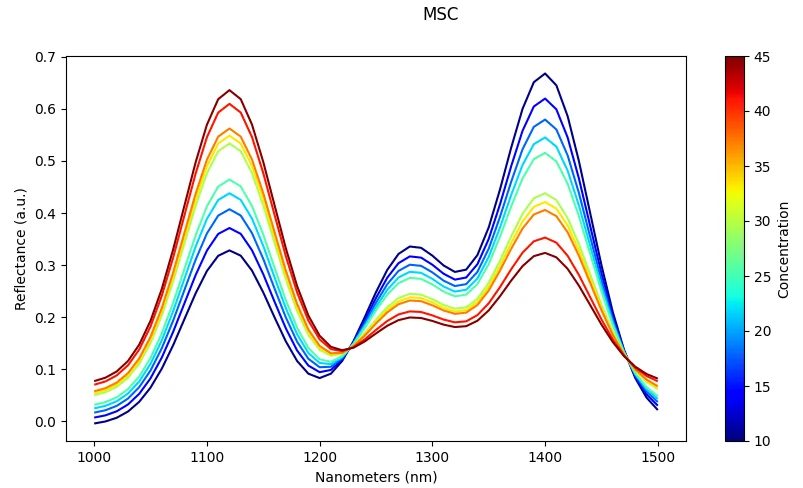
MSC (Multiplicative Scatter Correction)
What it does: Adjust each spectrum relative to a reference spectrum (typically the mean spectrum).
Effect: Removes slope and baseline variation caused by scattering effects.
Risk: Requires a stable reference spectrum; performance degrades if the reference is not representative.
Dimension Reduction
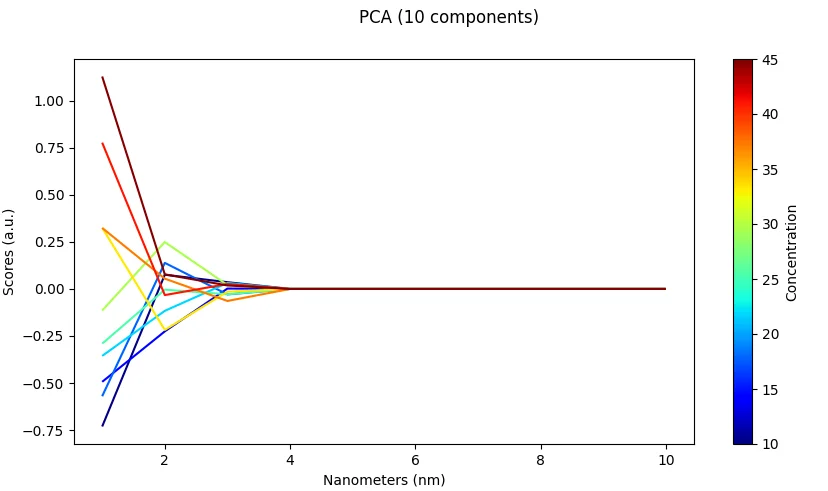
PCA (Principal Component Analysis)
What it does: Project spectra into fewer principal components that capture most of the variance.
Effect: Reduces noise, speeds up training, and decorrelates features.
Risk: Principal components may be harder to interpret physically; some information is always lost.
Smoothing & Signal Conditioning
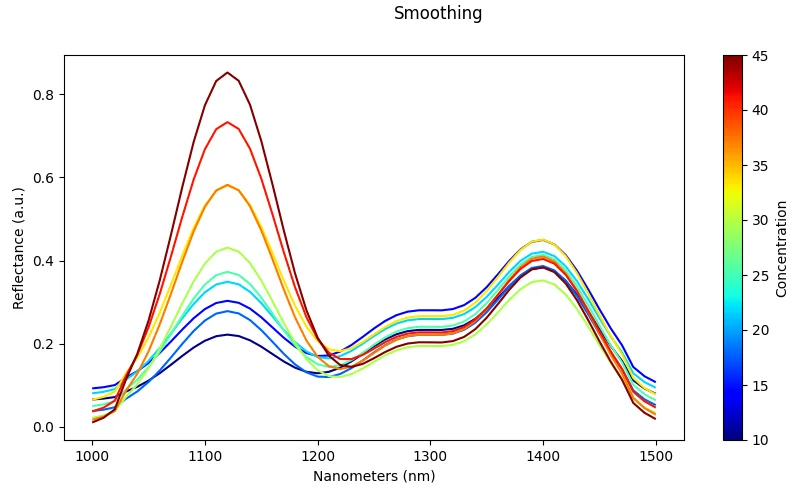
Smoothing (Moving Average / Median)
What it does: Reduces high-frequency noise using moving average or median filters.
Effect: Produces cleaner signals that are easier for models to learn from.
Risk: Over-smoothing can blur narrow peaks and sharp spectral features that are important for discrimination.
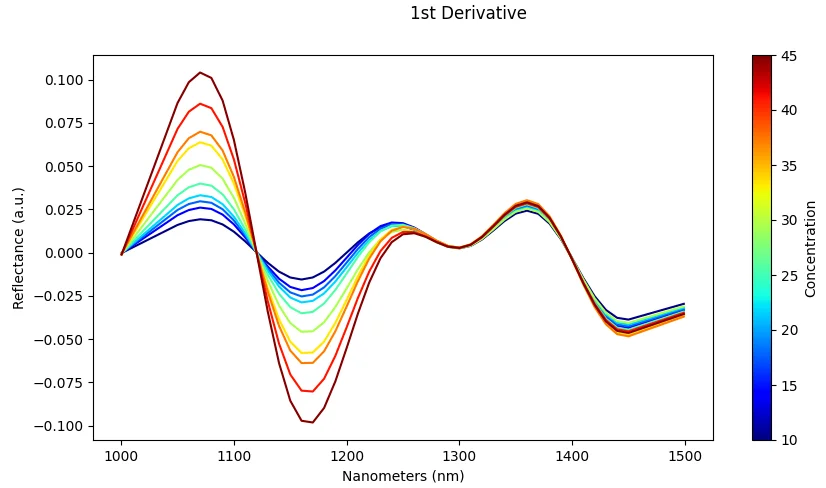
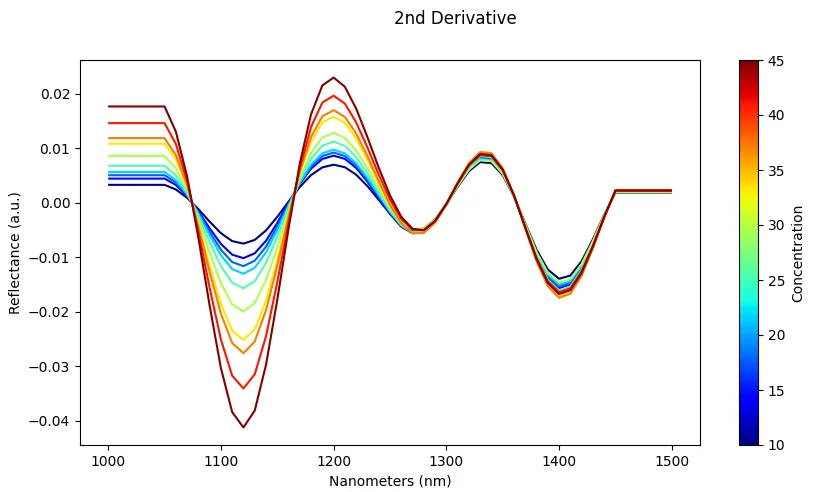
Derivatives (Savitzky–Golay)
What it does: Compute 1st or 2nd derivative of spectra using Savitzky-Golay filter.
Effect: Highlights peaks and removes baseline drift, enhancing spectral features.
Risk: Amplifies noise if over-applied or if the signal-to-noise ratio is poor.
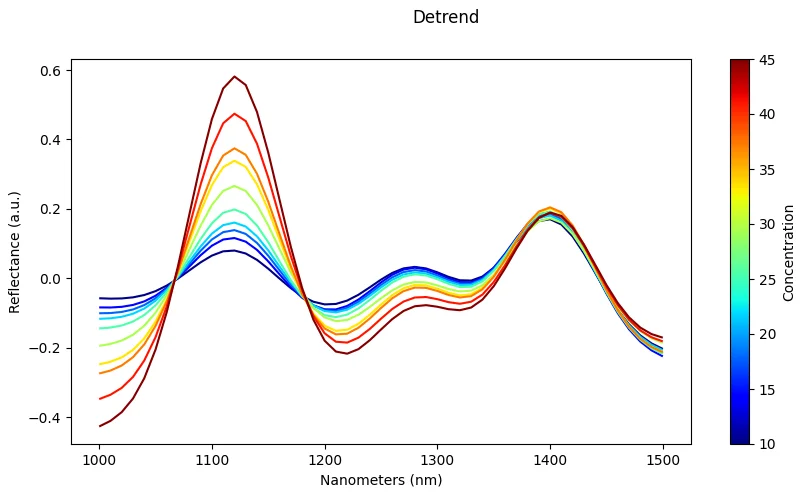
Detrending
What it does: Remove low-order polynomial baseline from spectra.
Effect: Corrects baseline shifts and drift in spectral measurements.
Risk: May distort broad absorption features that span many wavelengths.
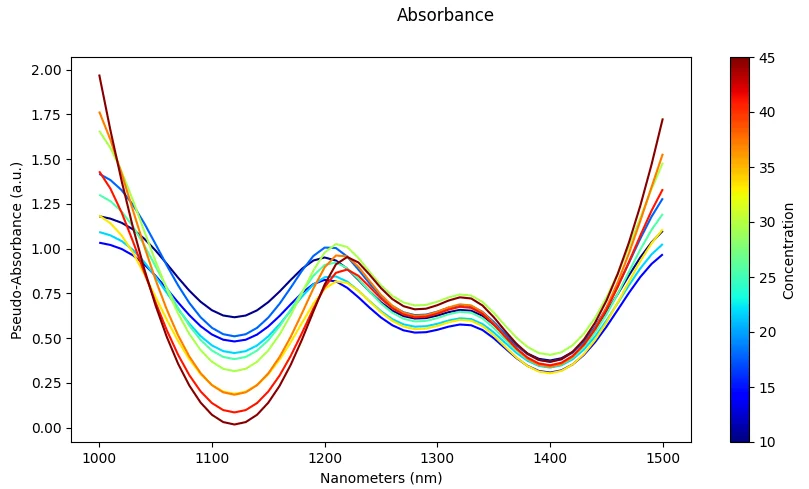
Absorbance Conversion
What it does: Convert reflectance to absorbance using A = log₁₀(1/R).
Effect: Standard transformation in spectroscopy workflows; linearizes Beer-Lambert relationships.
Risk: Invalid if reflectance values are ≤ 0; produces undefined or infinite values.
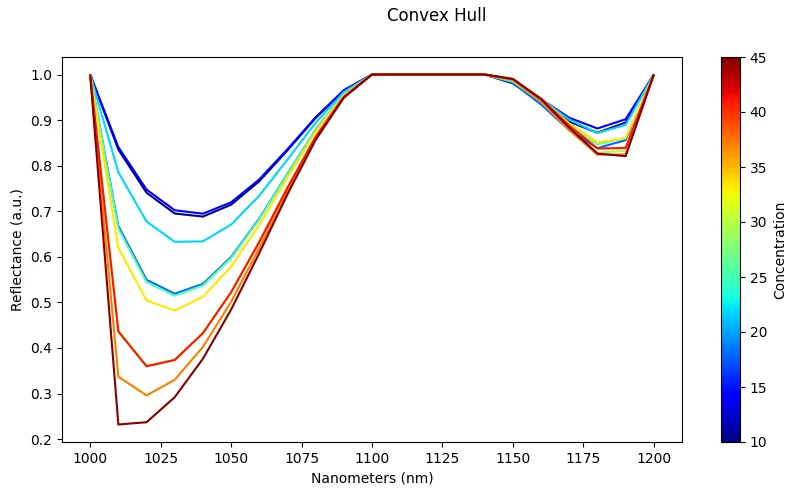
Continuum Removal
What it does: Normalize spectra by their convex hull continuum.
Effect: Emphasizes absorption band depths relative to the background continuum.
Risk: Sensitive to noise in the spectrum; can distort features at the edges of the spectral range.
Best Practices
Choosing Preprocessing Methods
- Understand your data: Analyze your spectra to identify the dominant sources of variation (illumination, scattering, baseline drift)
- Start simple: Begin with basic normalization or scaling before applying more complex methods
- Combine strategically: Use complementary methods (e.g., SNV + derivatives) to address multiple issues
- Validate effects: Always check preprocessing results visually to ensure you're not introducing artifacts
- Be consistent: Apply the same preprocessing pipeline to training, validation, and test data
When to Use Each Method
| Method | Best For | Avoid When |
|---|---|---|
| SNV | Reflectance data with scatter | Transmission spectra, low SNR |
| MSC | Uniform scattering effects | Highly variable sample types |
| Derivatives | Baseline drift, overlapping peaks | High noise levels |
| Smoothing | Noisy data | Sharp narrow peaks are critical |
| PCA | High-dimensional data, noise reduction | Physical interpretation is needed |
| Normalization | Illumination differences | Absolute intensity is discriminative |
| Absorbance | Reflectance → Beer-Lambert | Any reflectance values ≤ 0 |
See Also
- Data Augmentation — Expand your training data with augmentation
- Advanced Settings — Configure model hyperparameters
- Training Metrics — Monitor preprocessing effectiveness